pv magazine test: February 2024 Results
By George Touloupas
This article was originally published in pv magazine – April 2024 edition. Learn more about the pv magazine test here.
George Touloupas, senior director of technology and quality for Clean Energy Associates (CEA), analyzes the February 2024 energy-yield results from the outdoor testing field in Xi’an, China.
Restructuring of our installation has been completed, and the system was reconnected on Feb. 3, 2024. The LR5-72- HTHF-585 product from Longi uses a special frame design to reduce dust accumulation and its performance will be compared against the LR5-72-HTH 585 product, to assess its efficiency in self-cleaning.
Our measurements are inevitably impacted by multiple factors, especially differences among inverters and meters. After performing a special study, we estimate a total 1.5% relative uncertainty in the measurement system. To reduce the impact of this in ranking products’ performance, we introduced a ranking method, where products in each category that perform with a deviation smaller than 1.5% are grouped in the same rank, and each product category will have no more than four ranks (see table to the right). The average bifacial boost is 10.35% for Feb. 2024. Bifacial boost is defined as the relative advantage of the average specific energy yield of all bifacial products compared to the average specific energy yield of all monofacial PERC products.

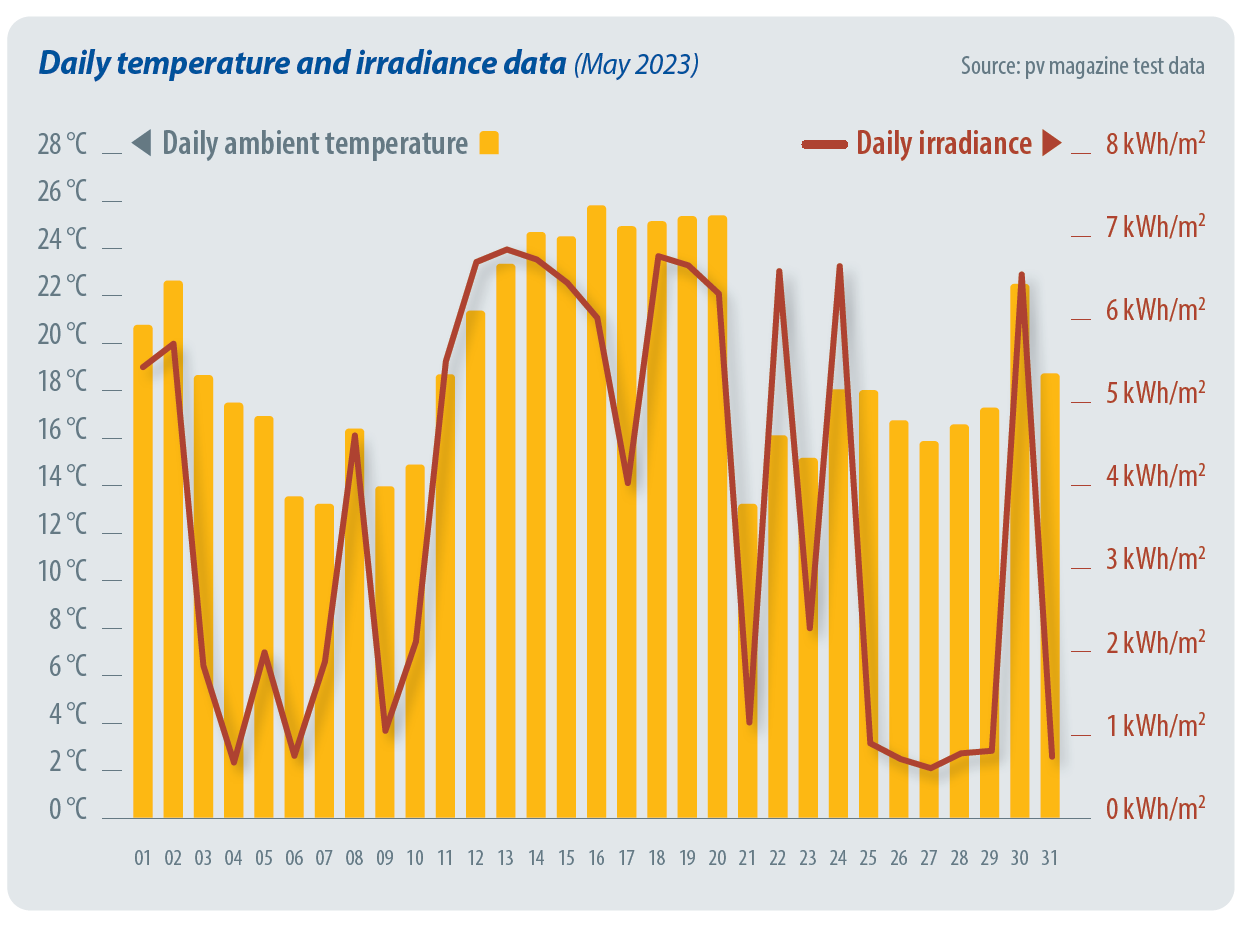
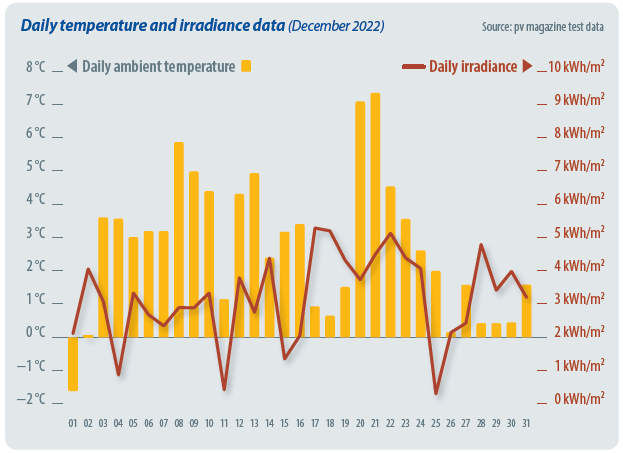
Figure 1: Daily temperature and irradiance data - February 2024

Table 1: Bifacial boost - October 2023 to February 2024
Monthly highlight
Low temperatures and snow in Xi’an significantly impacted module performance. Snow on different modules melted at different speeds, resulting in different inverter start-up times. Snow on bifacial modules melted faster than on monofacial modules, and snow on the Recom product melted faster than any other monofacial products.

Table 2: Specific energy-yield ranking of n-type bifacial (TOPCon and HJT) modules - February 2024
Table 3: Specific energy-yield ranking of bifacial PERC modules - February 2024
Table 4: Specific energy-yield ranking of monofacial modules - February 2024
Notes on the energy yield measurements:
The energy yield comparison among various technologies, including bifacial boost, is analyzed using products installed after the beginning of 2019.
The energy yield is given in Wh/Wp and calculated by dividing the energy produced by the module by the Pmax at STC of the module. This Pmax is the maximum STC power after a process of stabilization.
The results are in categories, per module type.
The bifacial boost depends on many parameters: the bifaciality factor, the installation geometry, the albedo of the ground, and the sun angle and diffuse irradiance. The ground in this case is gray gravel.

Figure 2: Specific energy yield of n-type bifacial (TOPCon and HJT), bifacial PERC, and monofacial modules - February 2024

Energy yield related to top performer in each category.

Figure 3: Relative yield of different technologies - February 2024
Test cooperation
pv magazine test is a cooperative effort involving pv magazine, CEA, Gsolar and Hoymiles. All testing procedures are carried out at Gsolar’s test laboratory in Xi’an, China. CEA supervises these tests and designed both the indoor and outdoor testing procedures.